Advanced PMM settings
Data retention
Data retention specifies how long data is stored by PMM Server. By default, time-series data is stored for 30 days. You can adjust the data retention time to balance your system’s available disk space with your metrics history requirements.
Telemetry
The Telemetry switch enables gathering and sending basic anonymous data to Percona, which helps us to determine where to focus the development and what is the uptake for each release of PMM. Specifically, gathering this information helps determine if we need to release patches to legacy versions beyond support, determine when supporting a particular version is no longer necessary, and understand the best frequency of releases.
PMM Telemetry is based on data collected by various PMM components and stored inside PMM Server
When PMM is installed, telemetry is not sent immediately. Before the first telemetry report is generated, PMM provides users with a 24-hour grace period to disable telemetry.
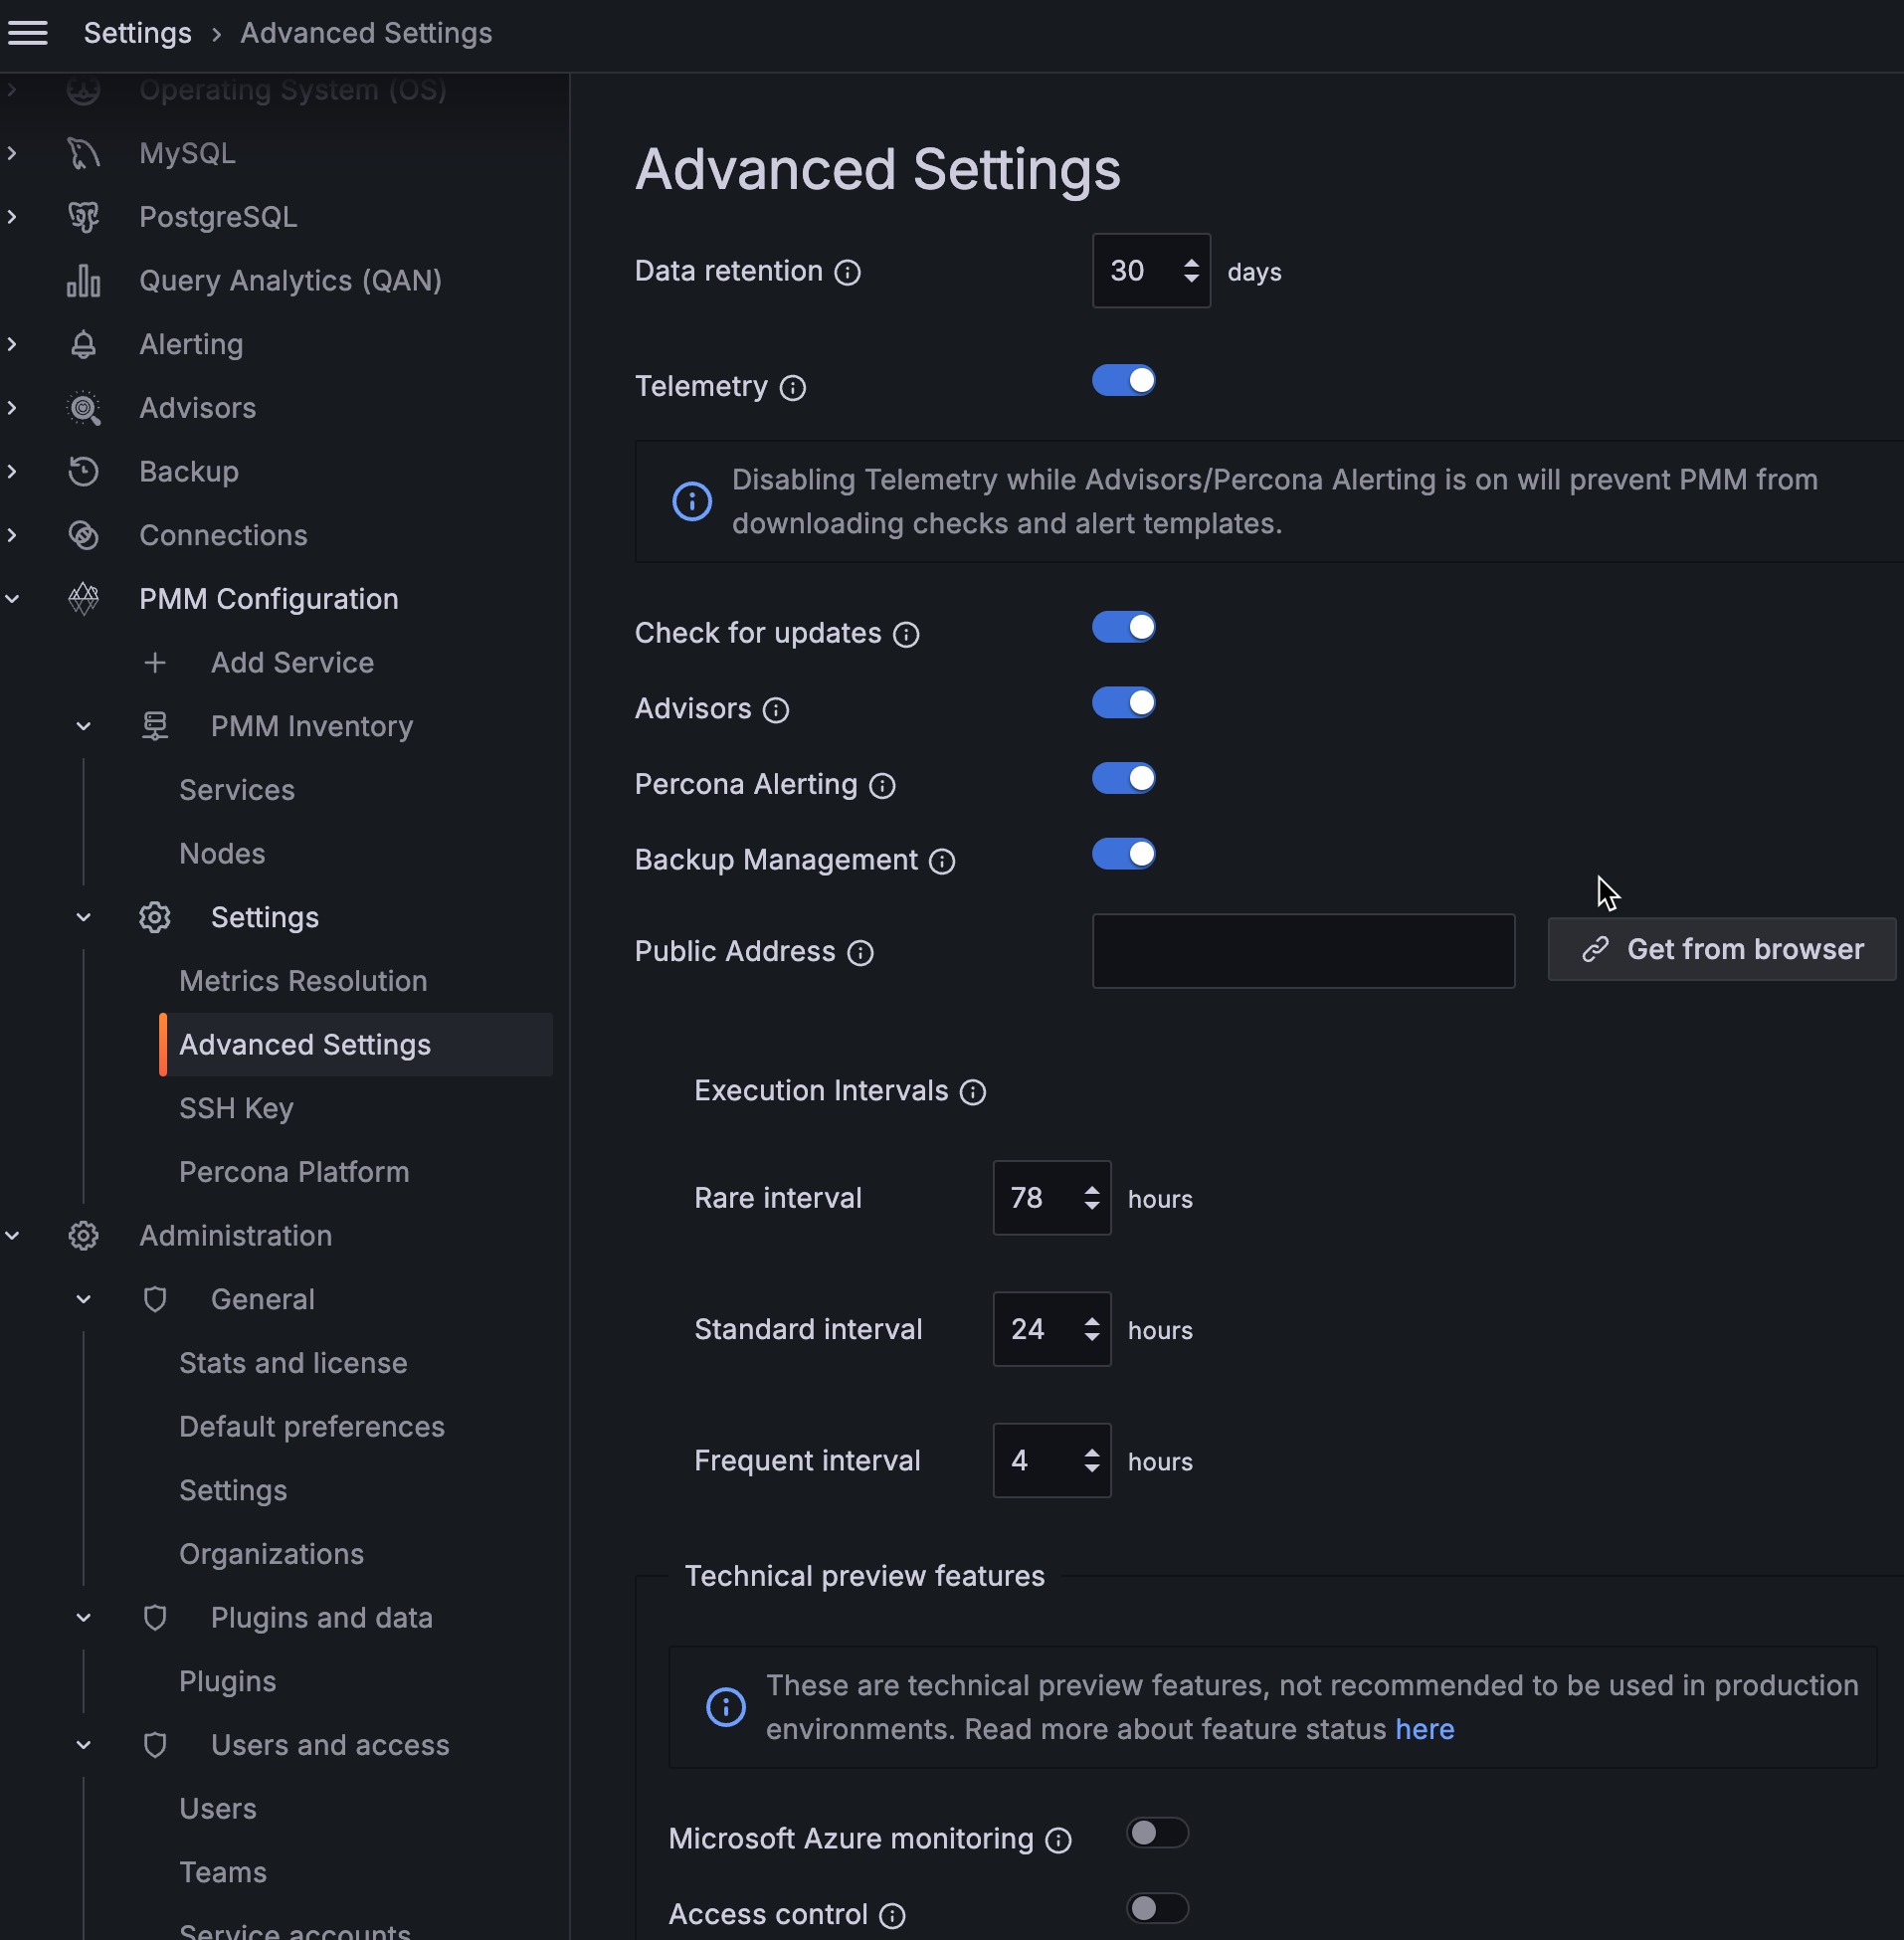
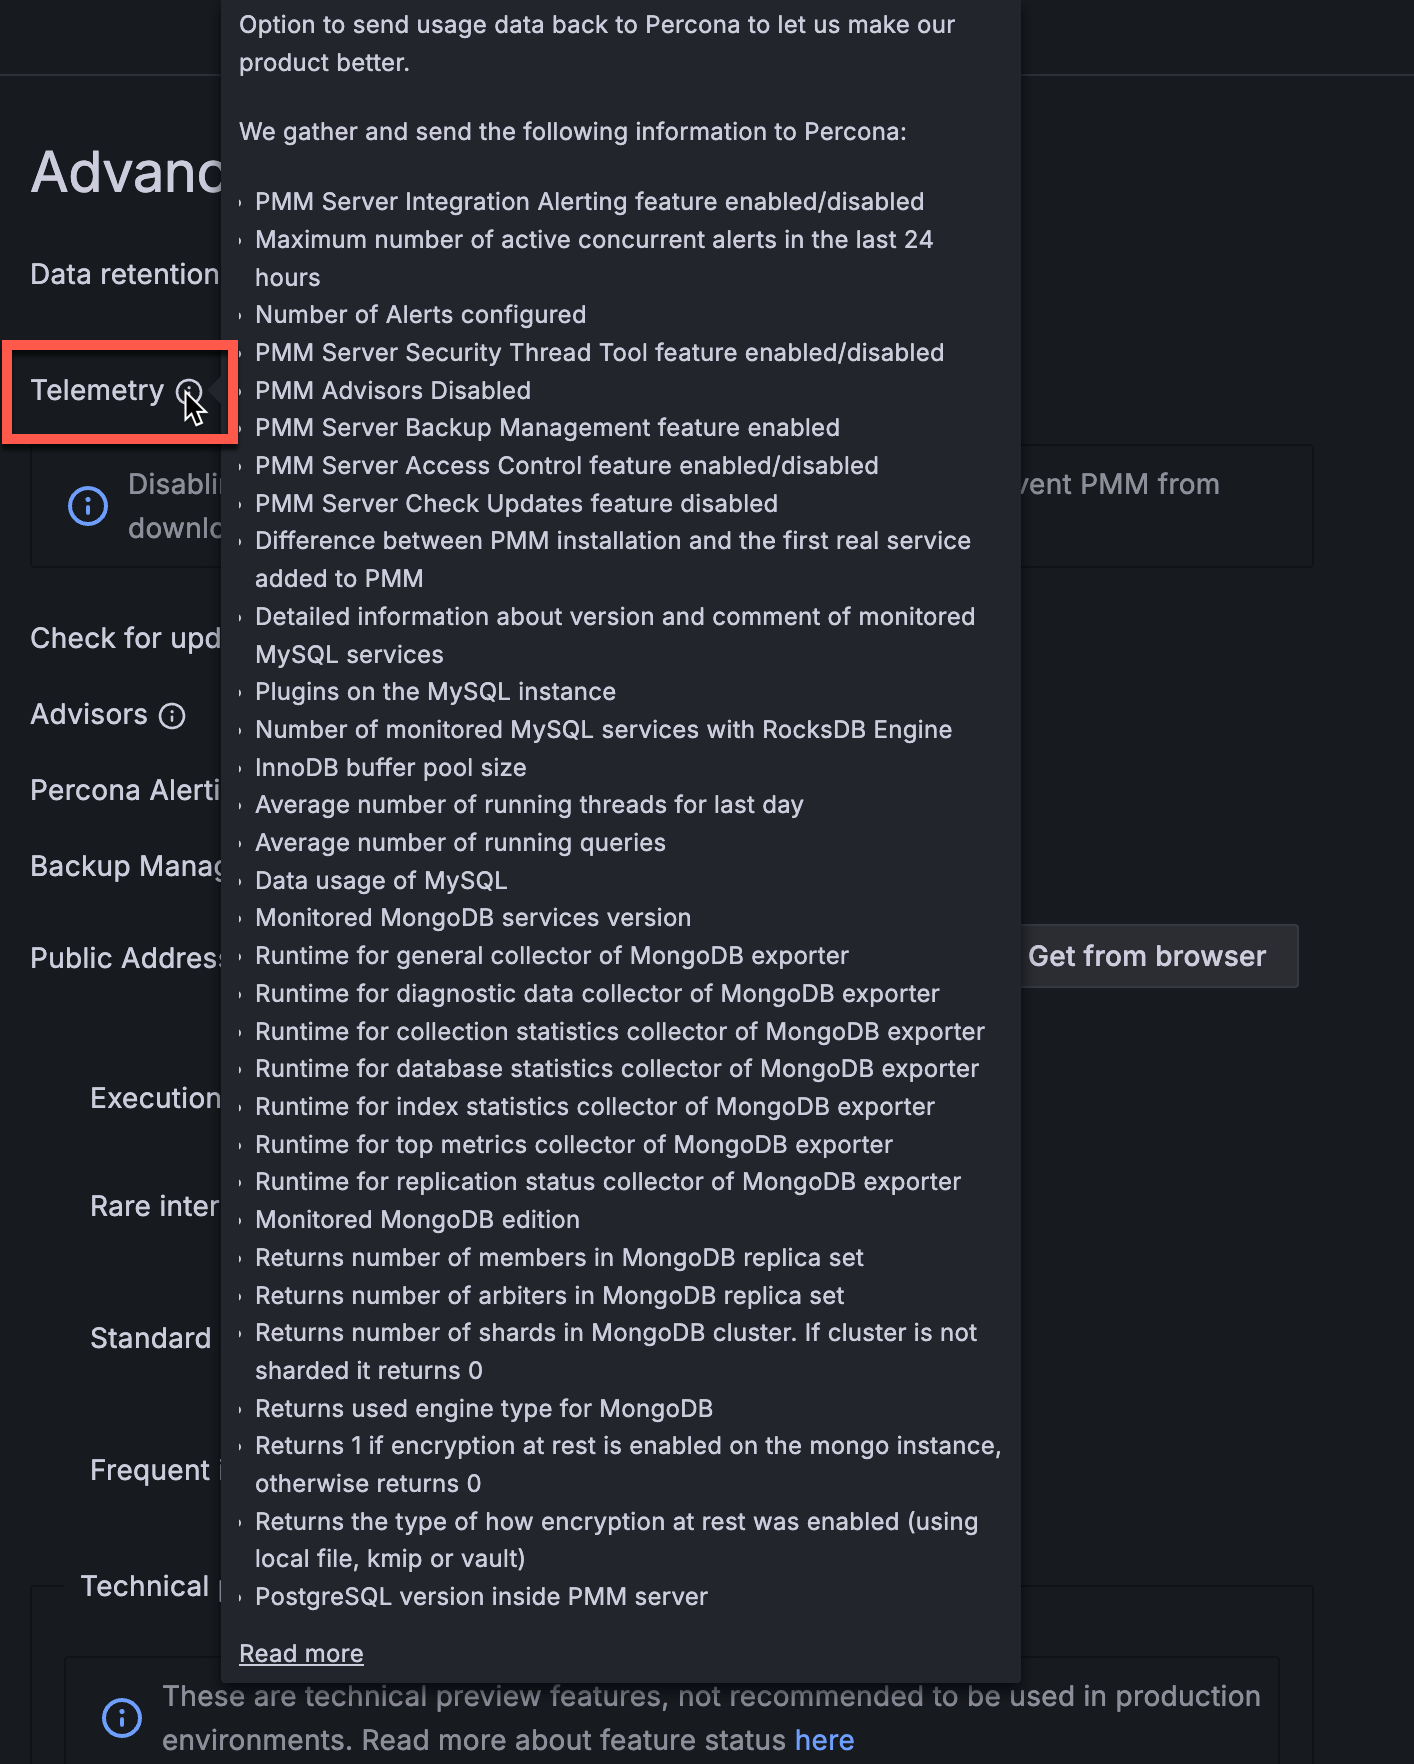
To see the metrics being collected by telemetry, from the main menu navigate to PMM Configuration > Settings > Advanced Settings > Telemetry and hover over the exclamation mark.
We do not gather anything that can identify your system, but consider the following:
-
The Country Code is evaluated from the submitting IP address before being discarded.
-
We do create an “instance ID” - a random string generated using UUID v4. This instance ID is generated to distinguish new instances from existing ones, for figuring out instance upgrades.
The first telemetry reporting of a new PMM Server instance is delayed by 24 hours to allow enough time to disable the service for those that do not wish to share any information.
The landing page for this service, check.percona.com, explains what this service is.
Grafana’s anonymous usage statistics is not managed by PMM. To activate it, you must change the PMM Server container configuration after each update.
As well as via the PMM Settings page, you can also disable telemetry with the -e DISABLE_TELEMETRY=1 option in your docker run statement for the PMM Server.
For information on the various config parameters for telemetry, see the config file.
Check for updates
When active, PMM will automatically check for updates and put a notification in the home page Updates dashboard if any are available.
Advisors
Advisors are sets of checks grouped by functionality that run a range of database health checks on a registered PMM instance.
The findings are reported on the Advisors > Advisor Insights page, and an overview is displayed on the Home dashboard.
The Advisors option is enabled by default. Checks are re-fetched and rerun at intervals.
See Working with Advisor checks.
Percona Alerting
Enables Percona Alerting and reveals the Percona templated alerts option on the Alerting page.
QAN for PMM Server
By default, Query Analytics (QAN) does not display queries from PMM Server’s internal PostgreSQL database, keeping your dashboards focused on monitored databases rather than PMM’s operational activity.
Enable this setting to troubleshoot PMM Server performance issues, monitor resource usage in High Availability (HA) deployments, or verify that applications aren’t misusing the default postgres database.
When enabled, open Query Analytics (QAN) from the main menu, then filter by the pmm-server-postgresql service to view PMM Server queries.
You’ll see queries related to PMM’s inventory, settings, advisor checks, alerts, backups, and authentication. These queries are typically lightweight so any spikes in volume, latency, or unexpected entries may indicate performance issues or database misuse.
Warning
The default postgres database should only be used by PMM’s internal operations. Applications should always use dedicated databases.
Backup Management
Enables Backup Management option and reveals the Backup page from where you can:
- create and restore MongoDB and MySQL backups
- automate backup scheduling
- set retention policies
- monitor your backup and restore activity
Public Address
The address or hostname PMM Server will be accessible at. Click Get from browser to have your browser detect and populate this field automatically.
Microsoft Azure monitoring
Caution
This is a technical preview feature.
Activates Microsoft Azure monitoring.