MySQL Query Response Time Details
Dashboard availability
This dashboard is only accessible via the Dashboards folder for MariaDB users. This dashboard only works with Percona Server for MySQL 5.7 (End of Life) and MariaDB 10.0.4+ when the Query Response Time plugin is enabled. It is not compatible with MySQL 8.0+.
For MySQL 8.0+ users: Use Query Analytics (QAN) with Performance Schema to monitor query performance and response times.
Overview
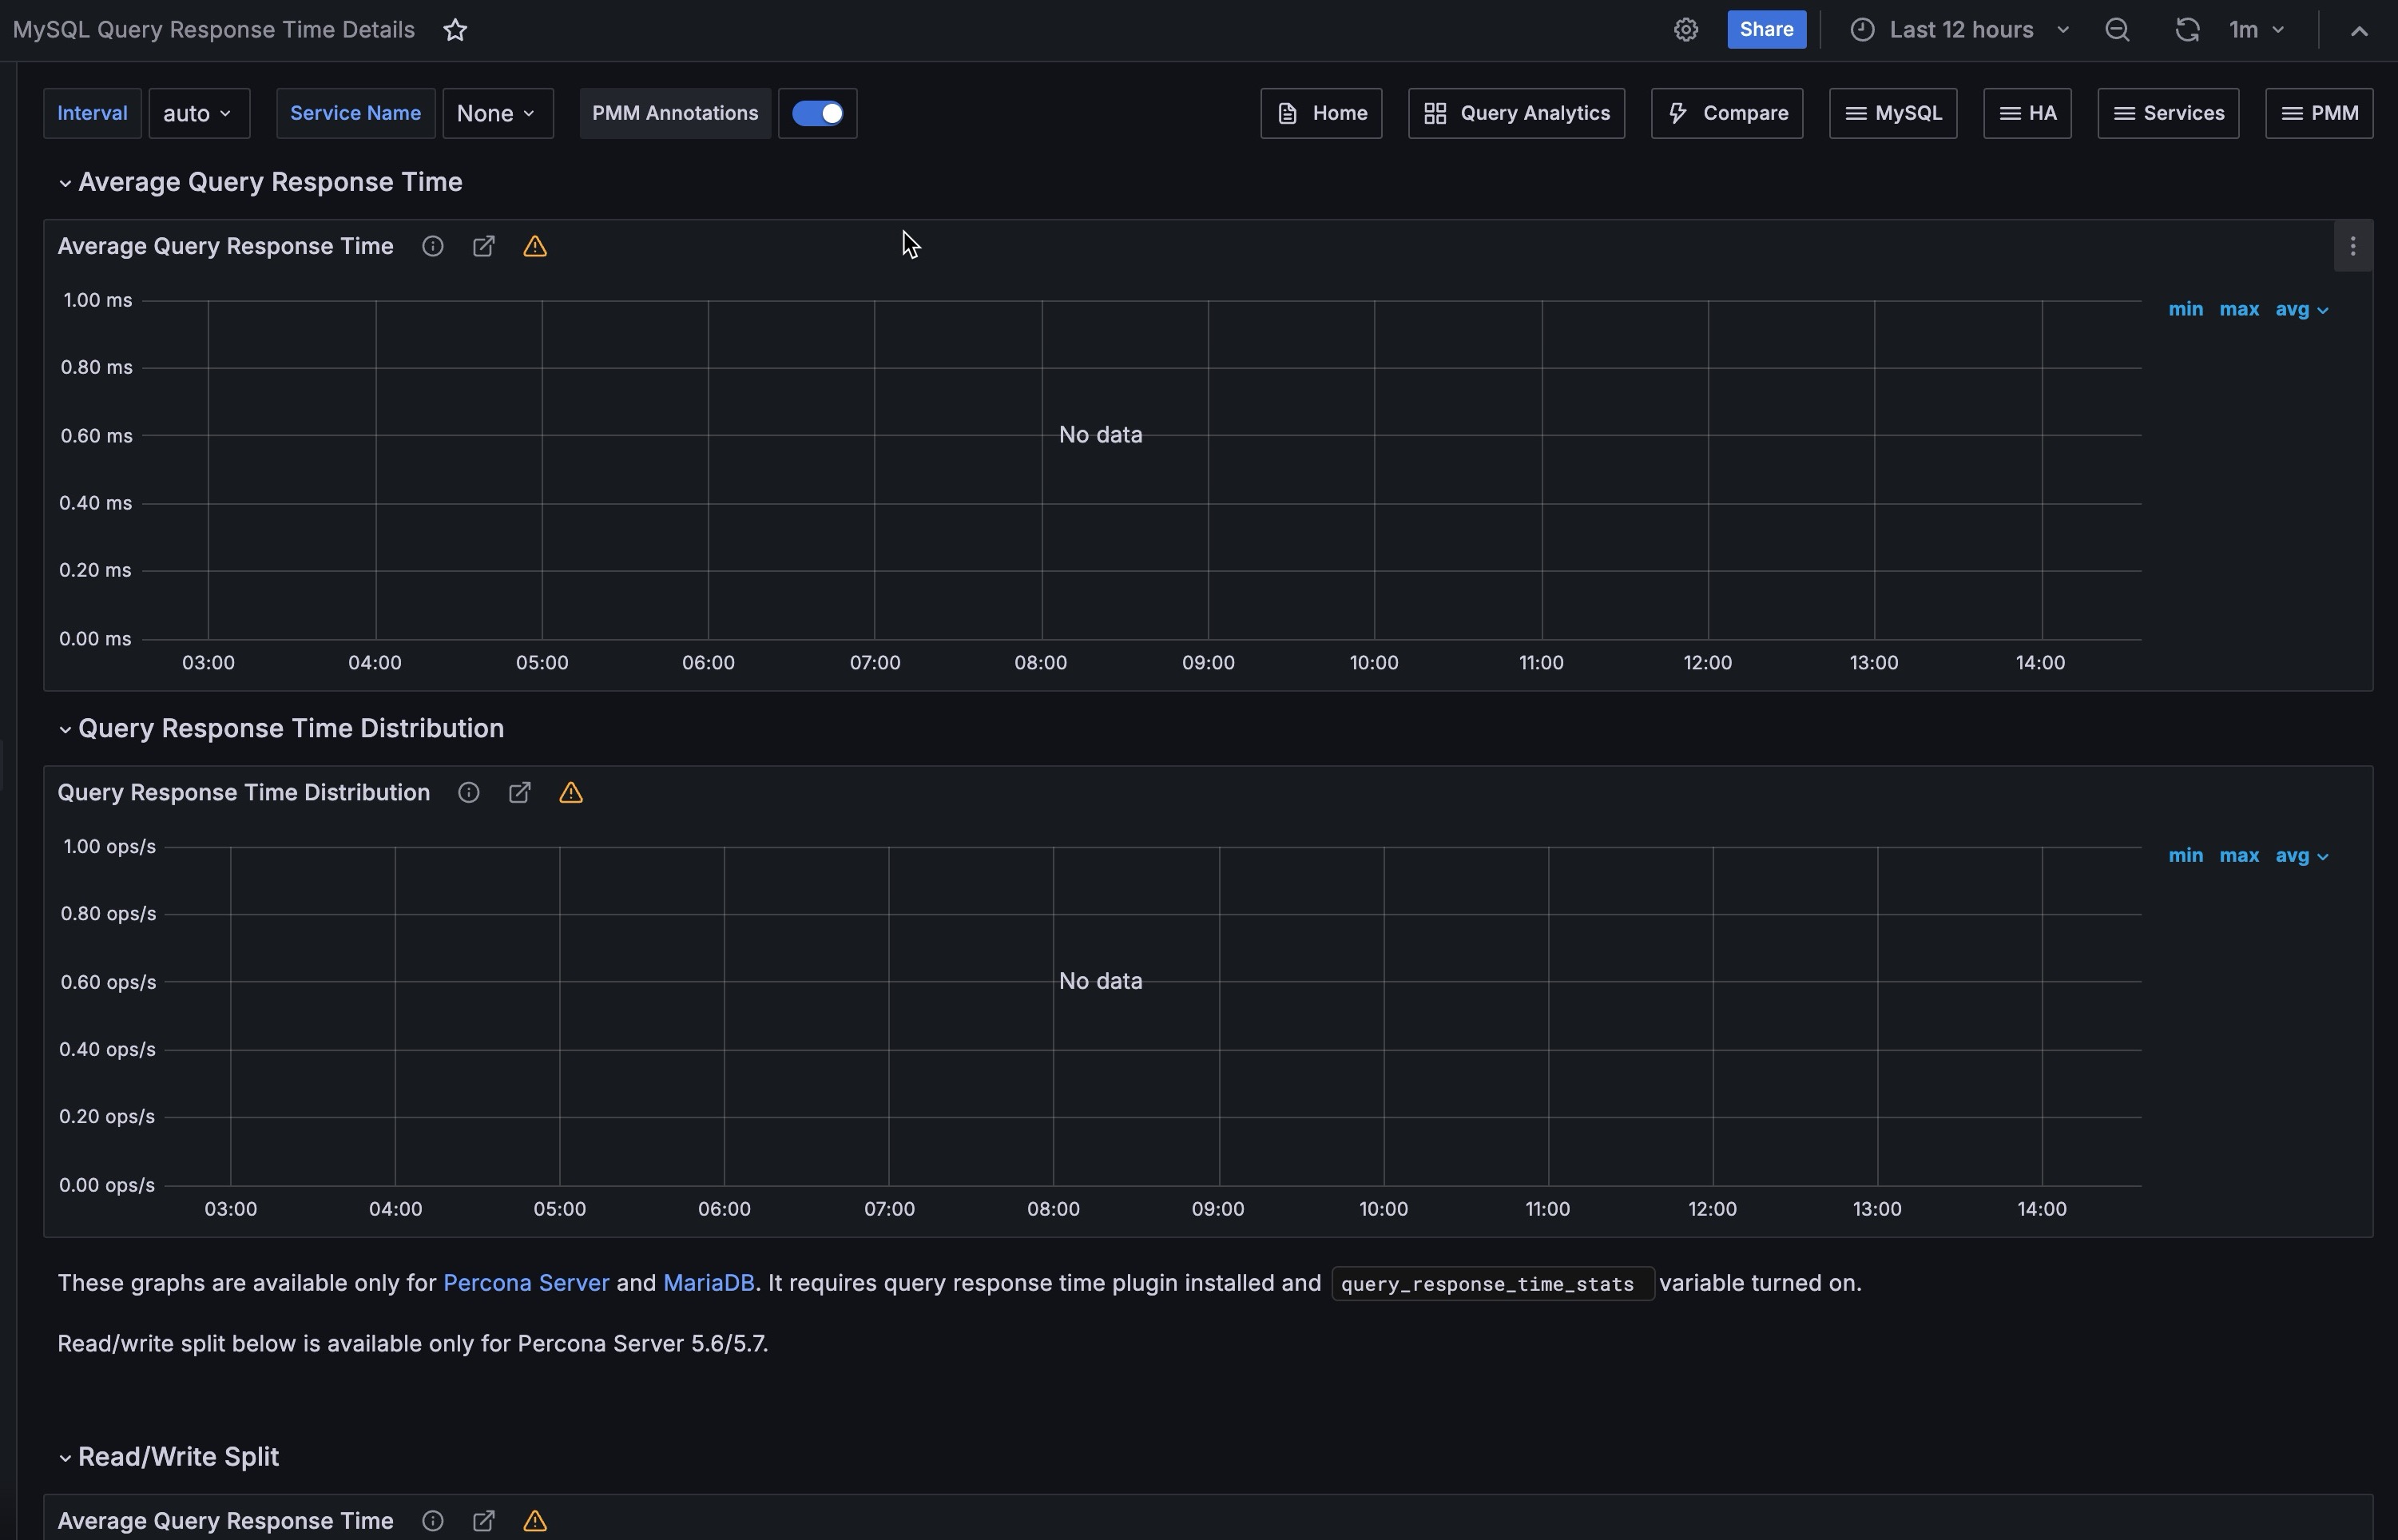
This dashboard displays query response time metrics collected using the Response Time Distribution plugin. The data is sourced from the INFORMATION_SCHEMA.QUERY_RESPONSE_TIME table.
Supported versions
- Percona Server for MySQL: 5.7 only (available through Post-EOL support program)
- MariaDB: 10.0.4+
- NOT supported: MySQL 8.0+ or Percona Server for MySQL 8.0+
Prerequisites
The Query Response Time plugin must be installed and enabled. See Query Response Time configuration for setup instructions.
Dashboard panels
Average Query Response Time
Shows the average query response time across all queries, calculated by dividing the total execution time (in seconds) by the total number of queries.
Data source: INFORMATION_SCHEMA.QUERY_RESPONSE_TIME
Query Response Time Distribution
Displays the count of queries grouped by response time buckets:
- 100 ms - 1 s: Queries completing between 100 milliseconds and 1 second
- 1 s - 10 s: Queries completing between 1 and 10 seconds
- > 10 s: Queries taking longer than 10 seconds
Average Query Response Time (Read/Write Split)
Available only in Percona Server for MySQL 5.7
Shows the average response time split between READ and WRITE operations, providing visibility into different query types’ performance characteristics.
Data sources:
- QUERY_RESPONSE_TIME_READ
- QUERY_RESPONSE_TIME_WRITE
Reference: Percona Server logging queries in separate read and write tables
Read Query Response Time Distribution
Available only in Percona Server for MySQL 5.7
Shows READ query counts grouped by response time buckets:
- 100 ms - 1 s
- 1 s - 10 s
- > 10 s
Write Query Response Time Distribution
Available only in Percona Server for MySQL 5.7
Shows WRITE query counts grouped by response time buckets:
- 100 ms - 1 s
- 1 s - 10 s
- > 10 s
Alternative for MySQL 8.0+
For MySQL 8.0 and later versions, this dashboard is not available. Instead, use:
- Query Analytics (QAN) with Performance Schema as the query source
- MySQL Performance Schema Details dashboard
- MySQL Instance Summary dashboard for general performance metrics