Valkey/Redis Load
This dashboard monitors workload distribution, throughput, and resource utilization across Valkey/Redis nodes and services.
Use it to track command rates, analyze read/write patterns, assess cache effectiveness, monitor I/O threading performance, and identify load imbalances that may require capacity adjustments or traffic redistribution.
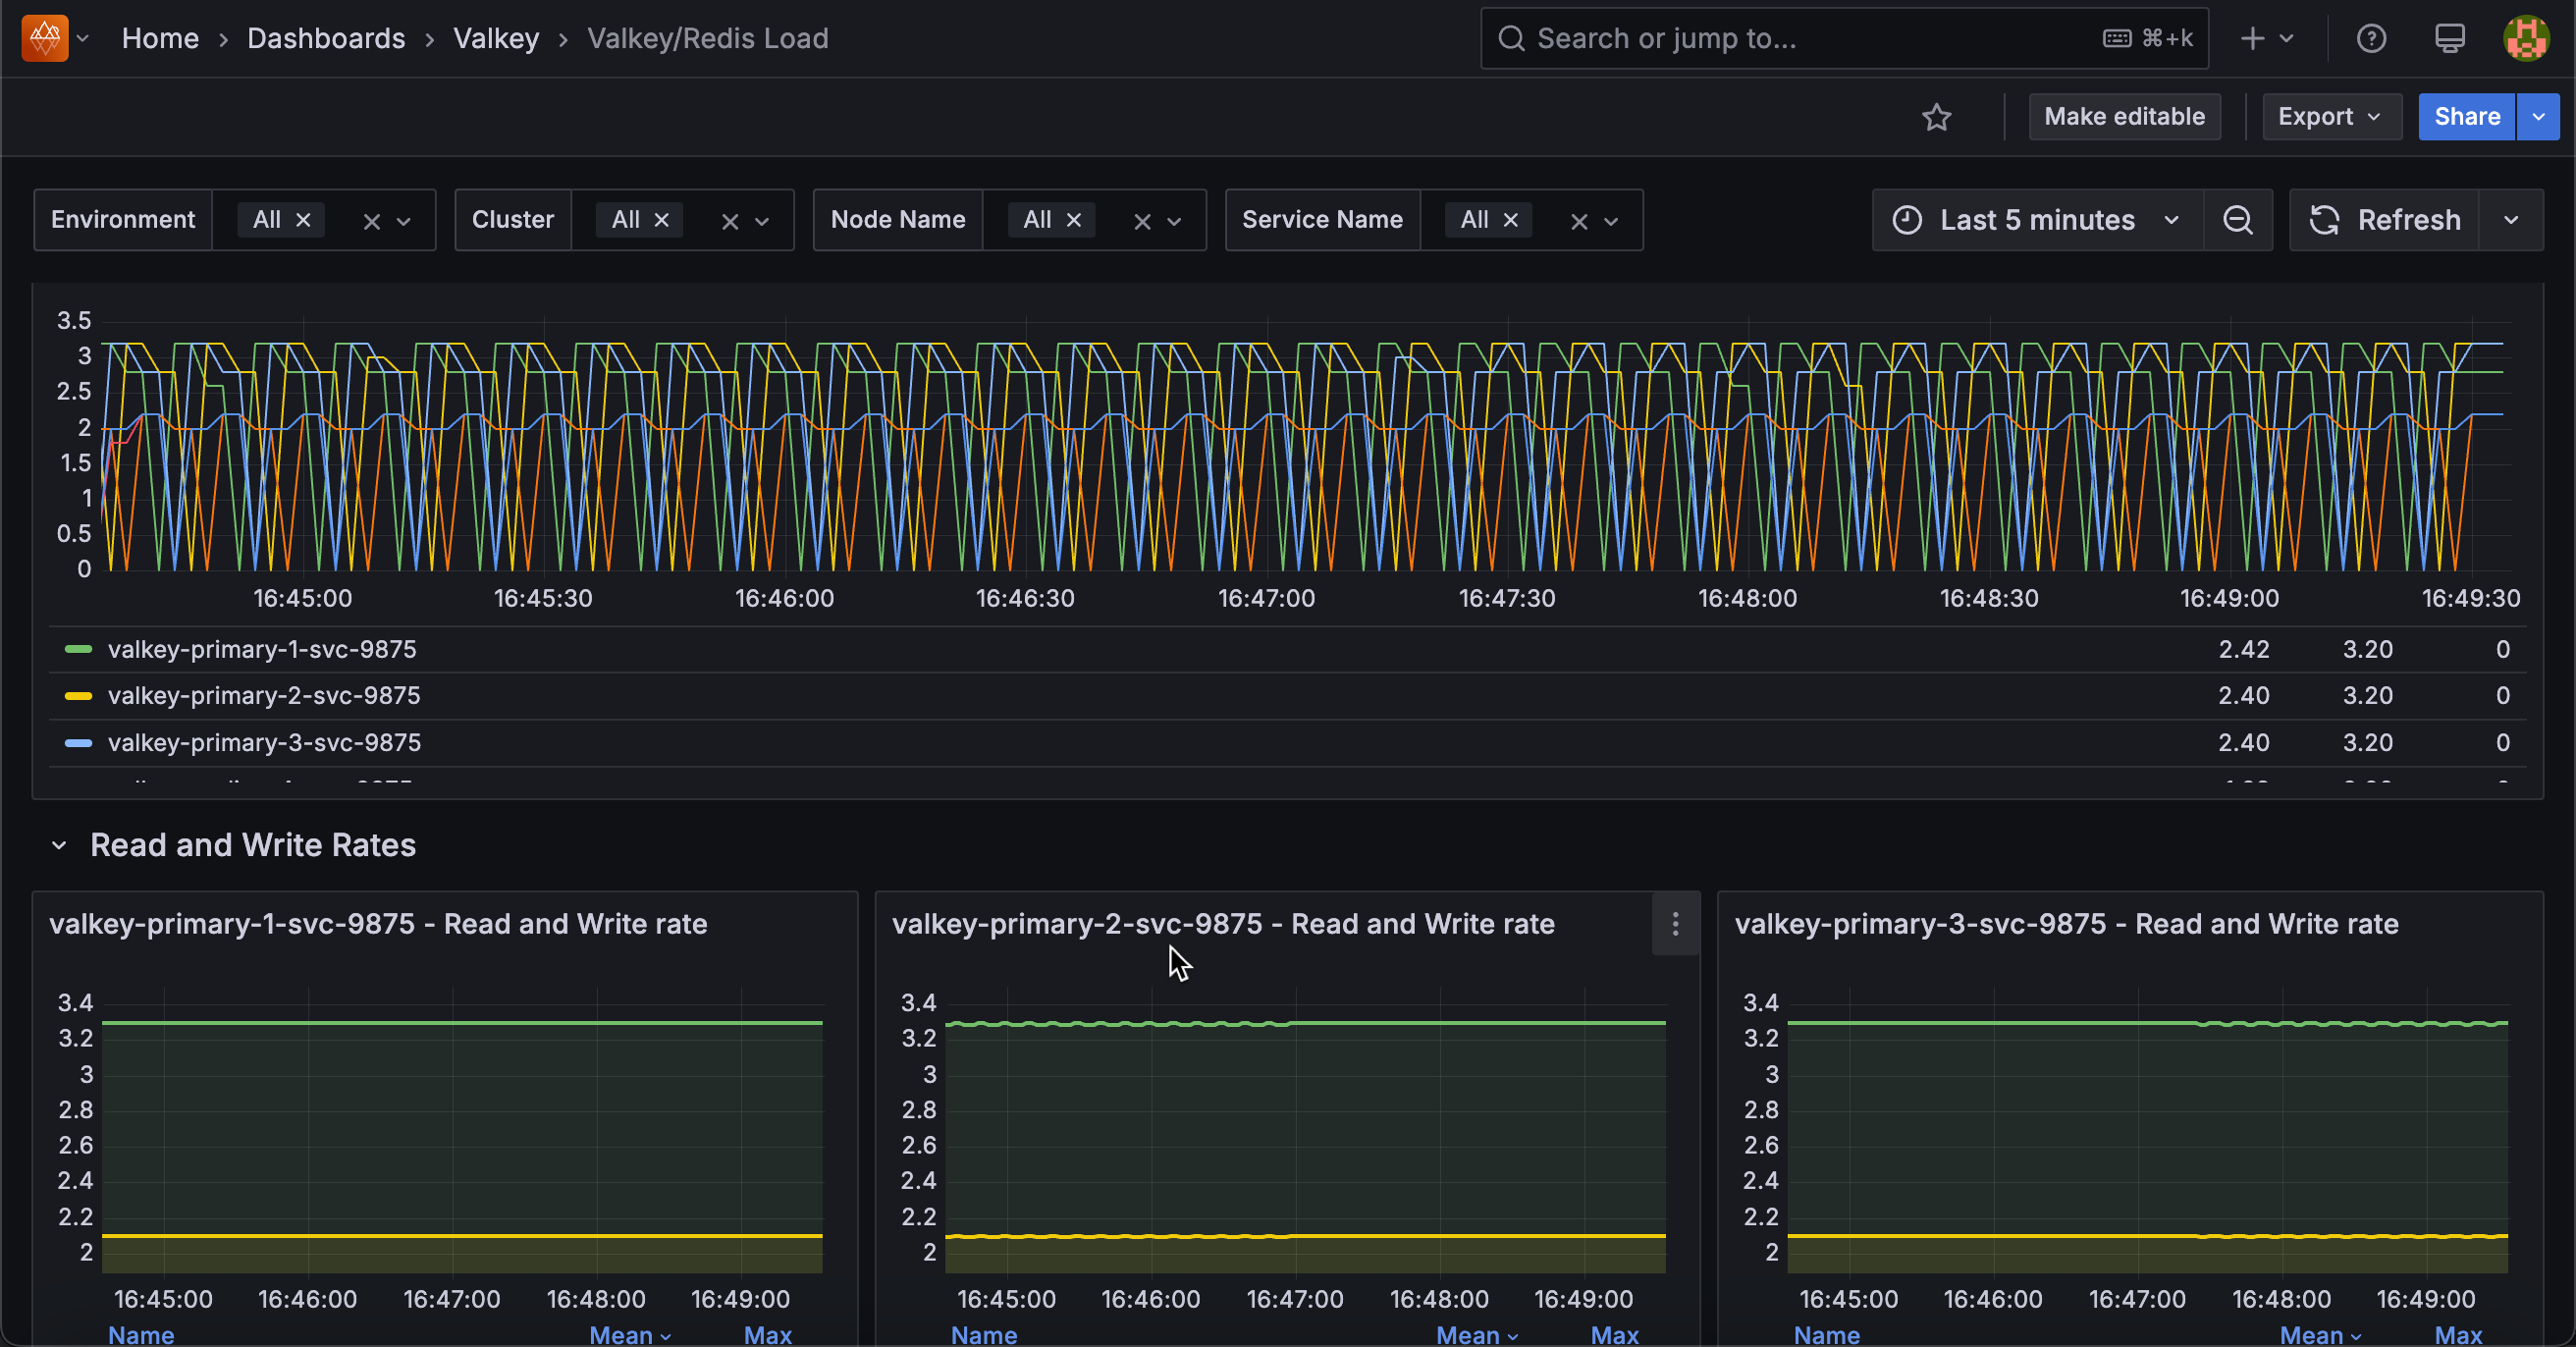
Total Commands/sec
[Node name] - Total Commands/sec
Displays the rate of all commands executed per second for each node.
Use this to monitor overall database activity and workload intensity at the node level. This aggregated metric shows total throughput of all command types, providing a high-level view of node busyness. Sudden spikes may indicate traffic surges, batch operations, or retry storms.
Unexpected drops could signal connectivity problems or reduced activity. Statistics show mean, max, and min rates sorted by average to identify the busiest nodes.
Compare values across nodes to detect load imbalances requiring traffic redistribution or to verify load balancing effectiveness. This metric indicates node utilization and helps with capacity planning.
Read and Write Rates
[Service name] - Read and Write Rate
Displays the rate of read and write operations processed per second for each service.
Use this to understand the balance between read and write workloads and monitor how load is distributed between different operation types.
Tracking these metrics separately helps identify whether services are read-heavy, write-heavy, or balanced, which informs optimization strategies and capacity planning.
Read-heavy services may benefit from additional replicas to distribute read load, while write-heavy services may need primary node optimization or sharding.
View mean, max, and min rates sorted by average to identify peak and typical load. Monitor read/write ratio changes for signs of application behavior changes, caching issues, or workload shifts.
Monitor these rates alongside total commands to understand what proportion of your traffic consists of reads versus writes.
Operations/sec by Command
[Node name] - Command ops/sec
Displays the rate of each command type executed per second for each node.
Use this to analyze command-level traffic patterns and identify which operations dominate each node’s workload. The stacked area chart shows each command’s contribution (GET, SET, HGET, ZADD, etc.) to total throughput.
The legend shows mean, max, and min rates for each command. Monitor this to detect load imbalances, identify optimization opportunities, and verify command distribution aligns with your architecture. High rates of slow commands on specific nodes may indicate the need for rebalancing or additional capacity.
Hits and Misses
[Node name] - Hits/Misses per Sec
Displays the rate of cache hits and misses per second for each node.
Use this to monitor cache effectiveness and understand how well your Redis/Valkey instance is serving data from memory. Cache hits occur when requested keys exist in the database, while misses happen when keys are not found, typically requiring the application to fetch data from a slower backend store.
A high hit rate indicates effective caching and good application performance, while a high miss rate may suggest cache warming issues, inappropriate TTLs, memory pressure causing evictions, or application queries for non-existent keys.
View mean, max, and min rates sorted by average. Calculate hit ratio as hits/(hits + misses) to assess cache health. Aim for 80-90% or higher.
Monitor this metric alongside eviction rates and memory usage to optimize cache sizing and ensure your cache layer is providing the expected performance benefits.
IO Threads
IO thread R/W per Sec
Displays the rate of read and write operations processed by I/O threads per second across services.
Use this to monitor Redis/Valkey’s threaded I/O effectiveness when enabled. I/O threading uses multiple threads for network operations, improving throughput on multi-core systems by offloading socket reading and writing from the main thread. The graph shows separate lines for threaded reads and writes.
Higher values indicate active I/O thread processing, which improves performance under high connection counts or throughput. If these metrics are zero or very low despite high command rates, I/O threading may not be enabled or configured optimally (check io-threads and io-threads-do-reads settings).
Statistics show mean, max, and min rates. Monitor alongside total command rates to assess whether I/O threading provides expected performance benefits.
IO Threads Configured
Displays the number of I/O threads configured for each service in a table format.
Use this to verify I/O threading configuration across your deployment. The table shows the io-threads setting, indicating how many threads handle network I/O operations.
A value of 1 means I/O threading is effectively disabled (single-threaded I/O), while values of 2 or more indicate multi-threaded I/O is active.
For optimal performance on multi-core systems, Redis/Valkey recommends 2-4 I/O threads, though the ideal number depends on your workload and hardware. Compare these values with actual I/O thread processing rates to ver