Percona Monitoring and Management 3.5.0
Release date: November 20, 20205
Percona Monitoring and Management (PMM) is an open source database monitoring, management, and observability solution for MySQL, PostgreSQL, MongoDB, and Valkey/Redis. PMM empowers you to:
- monitor the health and performance of your database systems
- identify patterns and trends in database behavior
- diagnose and resolve issues faster with actionable insights
- manage databases across on-premises, cloud, and hybrid environments
Release summary
Release highlights
Valkey and Redis monitoring support
PMM now provides native support for monitoring Valkey and Redis databases. Valkey is a high-performance open-source alternative to Redis that maintains full protocol compatibility, enabling PMM to monitor both databases using the same proven infrastructure.
For this, PMM includes ten dedicated Valkey/Redis dashboards that help you monitor performance, detect latency spikes, identify replication issues, and troubleshoot bottlenecks across your deployments.:
- Overview - Summarizes deployment health and performance.
- Clients - Shows client connections, blocked clients, and buffer usage.
- Cluster Details - Displays cluster topology, node roles, and replication offsets.
- Command Details - Analyzes command throughput, execution time, and latency patterns so you can optimize queries.
- Load - Tracks workload distribution, read/write patterns, and CPU/I/O usage.
- Memory - Monitors memory use, eviction policies, and keyspace metrics.
- Network - Shows network bandwidth and traffic patterns.
- Persistence - Reviews RDB and AOF operations and rewrite performance.
- Replication - Tracks replication lag, synchronization status, and backlog.
- Slowlog - Identifies slow commands and pinpoints performance bottlenecks. Full Query Analytics (QAN) support for Valkey/Redis is planned for a future release. Use Valkey’s built-in SLOWLOG command for detailed query analysis in the meantime.
To get stated, see Connect Valkey and Redis databases to PMM.
MongoDB dashboard improvements
We’ve made several enhancements to improve MongoDB monitoring:
- Renamed Query Execution Times panel to Operation Latencies in Router Summary, Sharded Cluster Summary, and Replica Set Summary dashboards for clarity
- Fixed duplicate service counts in MongoDB dashboards and node filtering issues in Replica Set Summary, Cluster Summary, and Router Summary dashboards
-
Added idle connect ions metric to the Connections panel in Cluster Summary and Replica Set Summary dashboards to help identify performance issues:

Query Analytics shows only your monitored databases
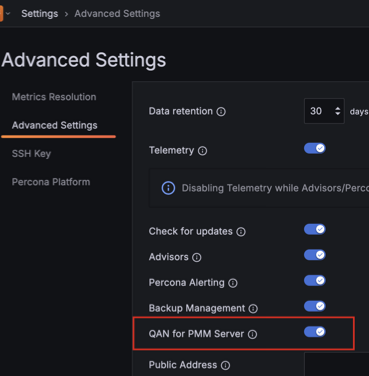
Query Analytics (QAN) now provides a cleaner view by excluding PMM Server’s internal PostgreSQL queries from the default display.
This helps you focus on your database performance without the distraction of PMM’s operational activity. If you need to monitor PMM Server queries for troubleshooting or High Availability scenarios, re-enable the option in PMM Configuration > Settings > Advanced Settings.
For details, see QAN for PMM Server.
Support for partial certificates for remote MySQL monitoring
PMM now supports adding remote MySQL instances using partial TLS configurations. You can configure TLS connections using only the CA certificate, without requiring client certificate and key files.
This enables you to:
- monitor Azure MySQL Flexible Server instances using only the downloaded
DigiCertGlobalRootCA.crt.pemcertificate - monitor Google Cloud SQL (MySQL) instances with single certificate files
- configure TLS connections using only the CA certificate, without requiring separate client certificate and key files
For instructions, see Connect MySQL databases to PMM.
Similar support for PostgreSQL will be available in a future release.
Improved data privacy: Disable query examples in the UI
You can now enhance data privacy in PMM by disabling the collection and display of sensitive SQL queries when adding MySQL or PostgreSQL services.
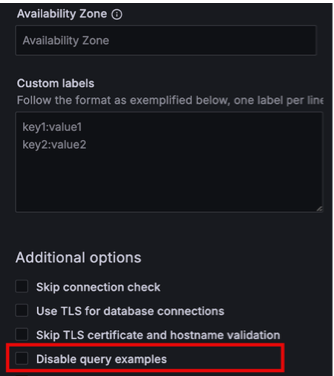
The new Disable query examples option prevents PMM from showing full SQL queries containing real data in QAN.
When this option is enabled, the Examples tab in QAN will not display any query examples, helping protect sensitive information while still providing valuable performance insights.
To enable, go to PMM Configuration > PMM Inventory > MySQL/PostgreSQL > Add Service > Additional Options and select Disable query examples:
Components upgrade
Improvements
-
PMM-14118 PMM now automatically generates SSL certificates for ClickHouse database connections to improve security and eliminate certificate error messages in ClickHouse logs.
-
PMM-10461: Improved compatibility with proxy servers. All Nginx redirects now use relative paths instead of a mix of absolute and relative redirects. This prevents issues with external proxies and aligns behavior with Grafana.
-
PMM-6659: Query Analytics now hides PMM Server’s internal PostgreSQL queries by default, keeping the view focused on your monitored databases. You can re-enable this in PMM Configuration > Settings > Advanced Settings for troubleshooting or HA scenarios.
-
PMM-13782: We’ve removed MySQL Query Response Time Details from the main navigation menu. You can still access this dashboard in Dashboards > MySQL if you’re a MariaDB user with the Query Response Time plugin enabled. This change streamlines your navigation experience, as the dashboard only supports outdated Percona Server for MySQL 5.7. If you’re using MySQL 8.0 or later, use Query Analytics (QAN) with Performance Schema.
-
PMM-14108: Added idle connections metric to the Connections panel available in MongoDB Cluster Summary and Replica Set Summary dashboards. Idle connections are now displayed alongside Available and Current connections to help identify potential performance issues.
-
PMM-14107: Renamed the Query Execution Times panel to Operation Latencies in MongoDB Router Summary, Sharded Cluster Summary, and Replica Set Summary dashboards to better reflect the actual metrics being displayed.
-
PMM-14271: Fixed misleading status indicators for disabled agents in PMM Inventory. Disabled agents now display Disabled status with grey background instead of Unknown, clearly indicating they are intentionally disabled rather than failing. The Services tab Monitoring status has been improved: services show OK (green) when only non-critical agents are disabled, Warning (orange) when multiple agents are disabled, and Failed (red) when agents are actually failing.
-
PMM-14006: Added Disable query examples checkbox when adding MySQL and PostgreSQL services. Enable this to prevent PMM from collecting full SQL queries with literal data values in Query Analytics, showing only query fingerprints instead. Available under PMM Configuration > PMM Inventory > Add Service > Advanced Settings.
Fixed issues
-
PMM-14305: Fixed QAN service failures during PMM Server upgrades caused by interrupted database schema migrations. When the ClickHouse schema migration was interrupted, QAN would fail to start with “Dirty database version x” errors. PMM now automatically detects and completes the interrupted migration, allowing QAN dashboards to load normally.
-
PMM-14022: Fixed duplicate service counts in MongoDB dashboards and the MongoDB down alert rule on the Alert rules page caused by high-resolution and low-resolution exporter jobs being counted separately.
-
PMM-14106: Fixed MongoDB Command Operations and Collection Details panels in Replica Set Summary, Cluster Summary, and Router Summary dashboards to correctly apply the node filter selection. The panels now display data only for the selected node instead of always showing all nodes.